What Is an Antenna Radiation Pattern?
No real antenna radiates equally in all directions. A radiation pattern is a graph of how the radiated field (or power) varies with direction, measured at a fixed, large distance from the antenna. It answers the most practical question about any antenna: where does the energy go?
Direction is described with spherical coordinates centred on the antenna: the elevation angle θ measured from the z-axis and the azimuth angle φ measured around it. The pattern is defined in the far field, where its shape no longer changes with distance — Part 3 explains why that matters. By reciprocity, the same pattern describes how well the antenna receives from each direction.
Coordinates and the Normalized Pattern
Antenna engineers use a spherical coordinate system centred on the antenna. A direction is given by two angles: θ, measured down from the z-axis (0° to 180°), and φ, measured around the z-axis from the x-axis (0° to 360°). The far-field electric field has only two components, E_θ and E_φ, both perpendicular to the direction of travel.
In the far field every component falls off as e−jkr/r, so the field can be written as a distance term times a purely angular term. That angular term, scaled to a maximum of 1, is the normalized field pattern:
Radiation Pattern Representation
The same pattern can be drawn in several ways. Each makes different features easy to see:
Linear field |E|
Linear power |E|²
Logarithmic, dB
| Representation | What is plotted | Best for |
|---|---|---|
| Field pattern (linear) | |E(θ, φ)| / |E|max | Seeing the main beam shape; −3 dB point at 0.707 |
| Power pattern (linear) | |E|² / |E|²max | Seeing where the power goes; −3 dB point at 0.5 |
| Decibel pattern | 20 log₁₀|E|/|E|max | Side lobes, back lobes and nulls — small levels become visible |
| Gain pattern (dBi) | G(θ, φ) in dBi | Link budgets: shows absolute gain in every direction |
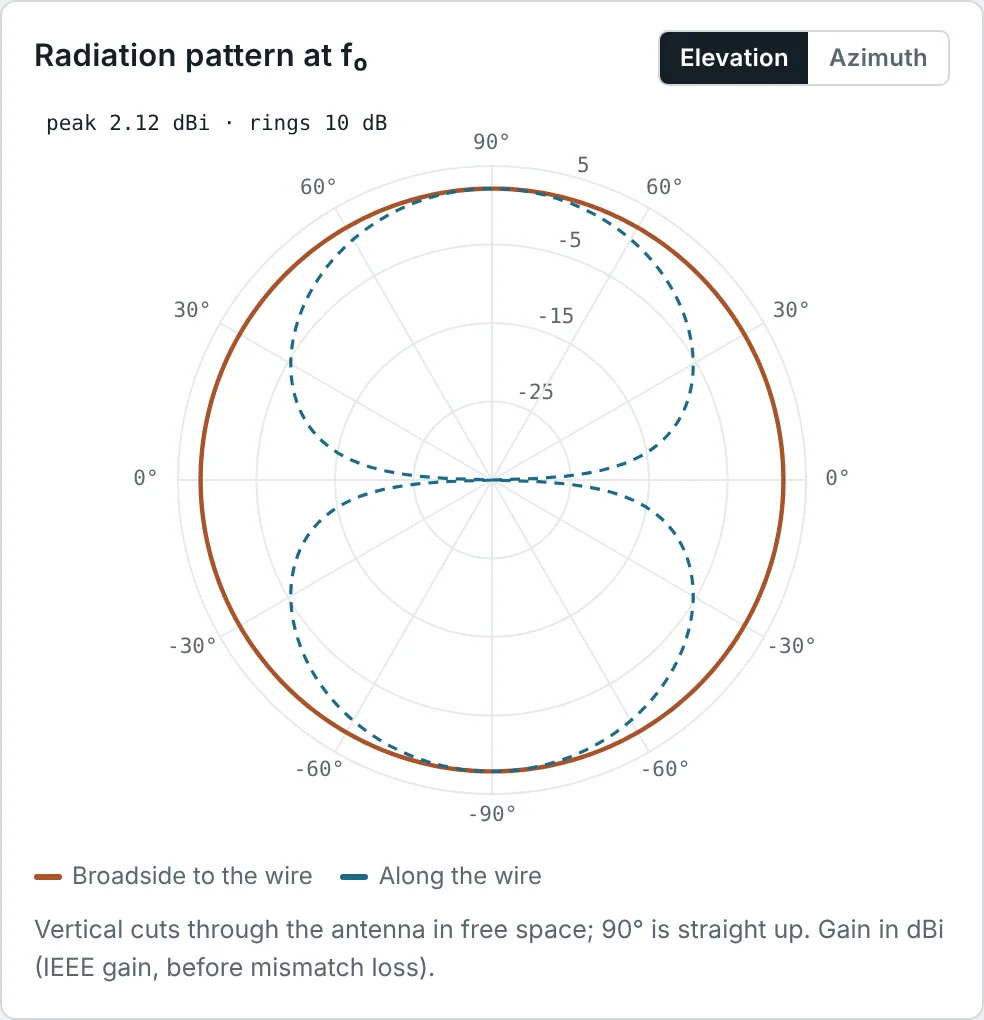
Because 20 log|E| and 10 log|E|² are the same number, a dB pattern is the same whether it started from field or power. Most datasheets and simulators therefore plot in dB, with rings every 10 dB, as in the calculator screenshots below. If decibels are new to you, see our guide to dB, dBm and dBi.
Where a Radiation Pattern Comes From
A pattern is not something we have to measure to know: it follows directly from the current on the antenna. The procedure is always the same — find the magnetic vector potential A produced by the current, keep only the terms that fall off as 1/r, and read off the angular dependence. We do it here for the three building blocks of antenna theory. The field equations themselves are developed in Part 10 of our Maxwell's Equations series.
Pattern of a Hertzian (Short) Dipole
Take a very short current element of length L ≪ λ along the z-axis, carrying a uniform current I. Its vector potential at distance r is
In the far field the electric field is simply −jω times the transverse part of A (the r̂-component does not radiate):
Pattern of a Half-Wave Dipole
A practical dipole is not short, so the current varies along it. For a thin centre-fed dipole of total length λ/2 the current is close to a standing wave that is maximum at the feed and zero at the tips: I(z′) = I₀ cos(kz′) for |z′| ≤ λ/4. Each piece dz′ is a Hertzian dipole; in the far field its distance to the observer is r − z′ cos θ, which shifts its phase by e+jkz′ cos θ. Adding them up:
The integrand's imaginary part is odd and vanishes; the real part integrates to (2/k)·cos(π/2 · cos θ)/sin²θ. Substituting:
Pattern Multiplication and the Array Factor
Directional antennas are very often arrays of identical elements. If N elements are placed along a line with spacing d and fed with equal amplitudes and a progressive phase β, the far field is the field of one element multiplied by a sum of phase terms. This is the principle of pattern multiplication:
The sum is a geometric series, so it has a closed form. Multiplying by (ejψ − 1), cancelling, and factoring out ejNψ/2 and ejψ/2:
The directional pattern in the lobe and beamwidth figures below is exactly this: four elements spaced λ/2 (kd = π, β = 0), each with a mildly directional element pattern (1 + 0.6 cos θ)/1.6 so that the back lobe is lower than the main lobe.
Three-Dimensional Radiation Patterns
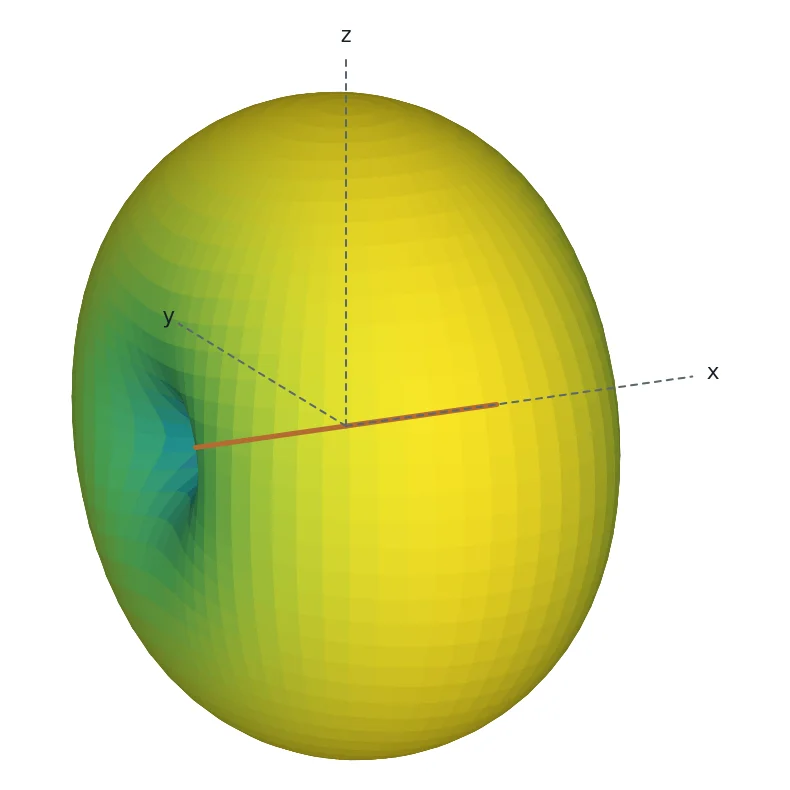
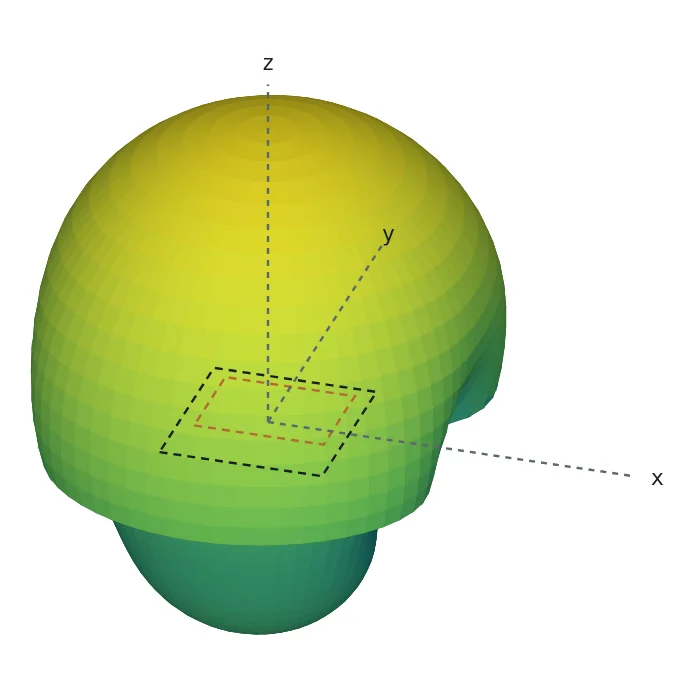
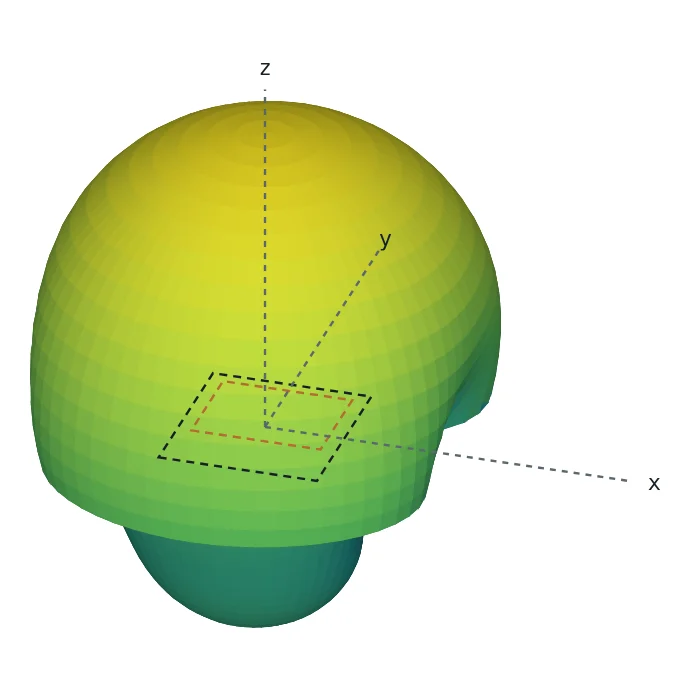
A 3D pattern draws a surface whose distance from the origin is proportional to the radiation in that direction. It gives the complete picture at a glance: the dipole's doughnut above, or the single forward-pointing beam of a microstrip patch below.
Two-Dimensional Radiation Patterns
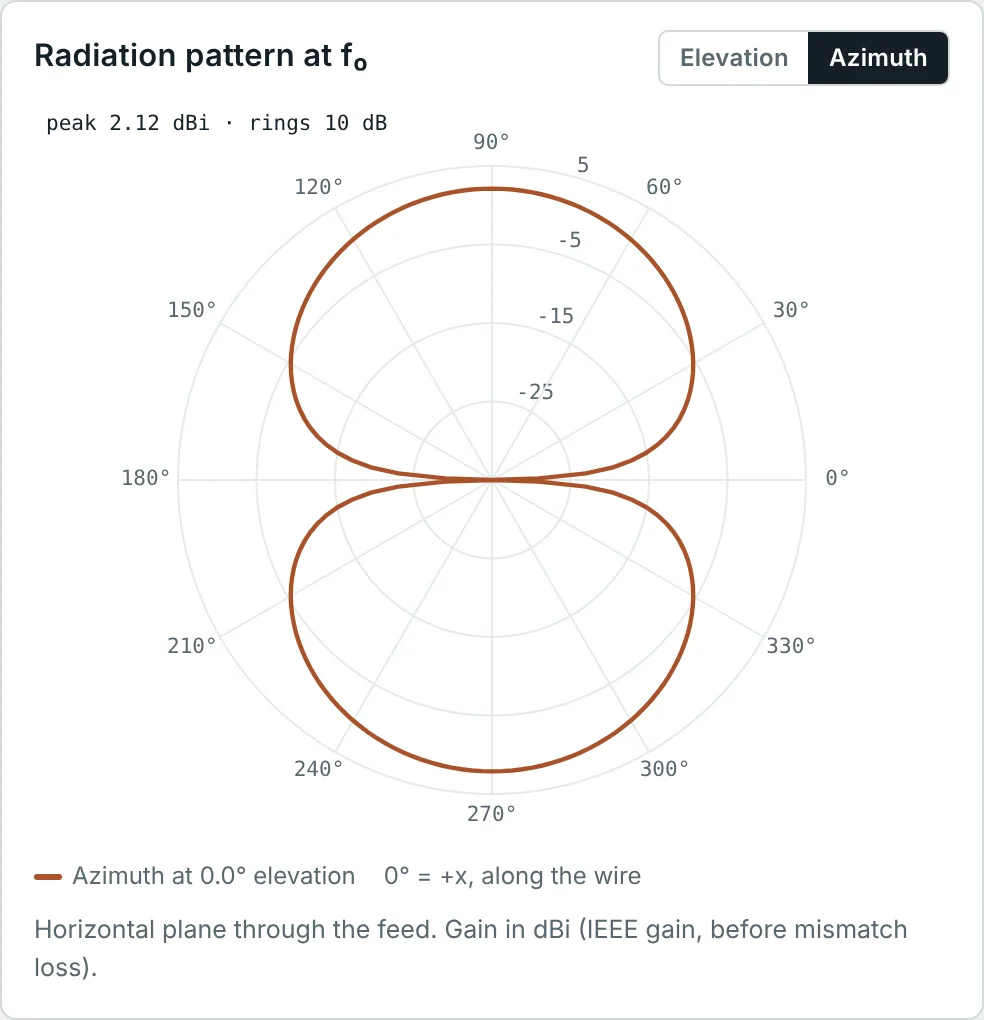
3D surfaces are hard to read numerically, so engineers mostly work with 2D cuts: slices through the 3D pattern along a plane, plotted on a polar chart (angle around the circle, level along the radius) or on a rectangular chart (angle along x, level in dB along y). Two cuts at right angles, through the direction of maximum radiation, describe most antennas well.
E-Plane and H-Plane Radiation Patterns
For a linearly polarized antenna, two specific cuts are standard:
- E-plane — the plane containing the electric field vector and the direction of maximum radiation.
- H-plane — the plane containing the magnetic field vector and the direction of maximum radiation. It is perpendicular to the E-plane.
Principal Plane Patterns
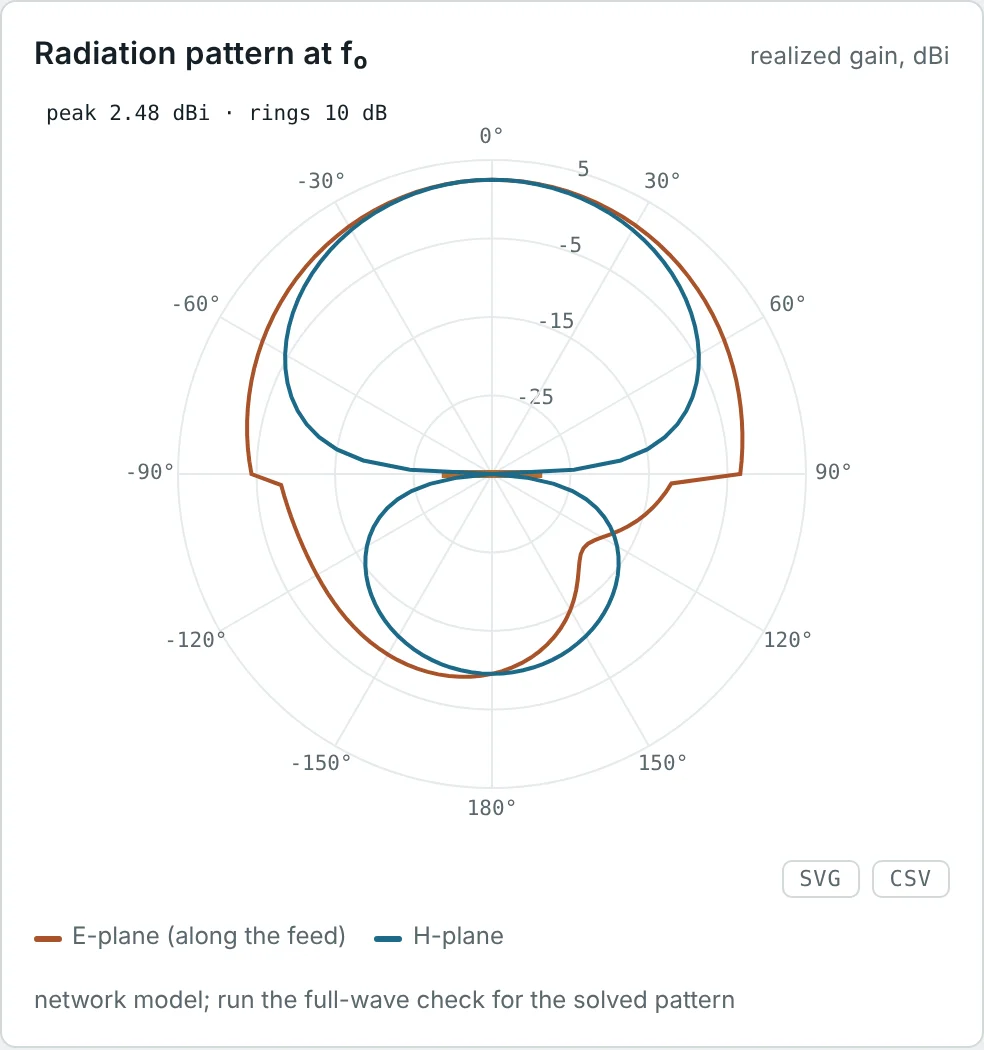
The E- and H-plane cuts are called the principal planes. For most antennas they line up with the coordinate planes, which makes measurements and datasheets consistent:
| Antenna (orientation) | E-plane | H-plane | Typical shapes |
|---|---|---|---|
| Vertical dipole or monopole (along z) | Any vertical plane (e.g. xz, φ = 0°) | Horizontal plane (xy, θ = 90°) | E: figure-eight · H: circle |
| Horizontal dipole (along x) | Horizontal plane containing the wire | Vertical plane broadside to the wire | E: figure-eight · H: circle (in free space) |
| Patch on xy plane, fed along y | yz plane (along the feed) | xz plane | Both: single broad beam towards +z |
| Horn, waveguide TE₁₀ (E along y) | yz plane | xz plane | E: narrower · H: wider, lower side lobes |
Most antennas also have a third common view: the azimuth cut in the horizontal plane, which is what matters for anything mounted on a mast or a ceiling.
Isotropic, Omnidirectional and Directional Patterns
Isotropic (reference only)
Omnidirectional (dipole, vertical cut)
Directional (4-element array)
Isotropic Radiation Pattern
An isotropic radiator radiates the same power in every direction: its 3D pattern is a sphere and every cut is a circle. No physical antenna can do this — the transverse nature of electromagnetic waves makes it impossible — but it is the universal reference. Gains quoted in dBi are relative to it.
Omnidirectional Radiation Patterns
An omnidirectional antenna has a non-directional (circular) pattern in one plane and a directional pattern in the perpendicular plane. A vertical dipole or monopole is the classic example: equal coverage in all horizontal directions, nulls straight up and down. This is what Wi-Fi access points, IoT nodes, FM broadcast and mobile phones need — the direction of the other end of the link is unknown or changing.
Directional Radiation Patterns
A directional antenna concentrates its radiation into one main direction. Yagi-Uda antennas, patches, horns, dishes and arrays are all directional. Concentrating the energy gives more range in the wanted direction and less interference in others, at the cost of having to point the antenna.
Main Lobe, Side Lobes and Back Lobe
The pattern of a directional antenna is divided into lobes — regions of radiation separated by nulls or deep minima.
| Lobe | Definition | Why it matters |
|---|---|---|
| Main (major) lobe | The lobe containing the direction of maximum radiation | Sets the coverage and the gain |
| Side lobes | Lobes next to the main lobe, usually in the forward half | Interference and susceptibility to jamming; the side-lobe level (SLL) is quoted relative to the main lobe, e.g. −13 dB |
| Back lobe | The lobe pointing opposite to the main lobe (≈ 180°) | Radiation behind the antenna, sets the front-to-back ratio |
| Minor lobes | All lobes except the main lobe — side lobes, back lobe and any others | Wasted power and unwanted coverage |
A uniform array of N elements has its first side lobes at about −13 dB for large N; tapering the element amplitudes (Taylor, Chebyshev weighting) lowers them at the cost of a slightly wider main beam.
Half-Power Beamwidth (HPBW)
The half-power beamwidth is the angle between the two directions in the main lobe where the radiated power has fallen to half its maximum: −3 dB, or 0.707 of the maximum field. It is the usual measure of how narrow a beam is, and it is quoted separately for the E-plane and H-plane.
HPBW of a Uniform Array
Near the main beam of a broadside array (β = 0, small θ), ψ = kd sin θ is small and sin(ψ/2) ≈ ψ/2, so the normalized array factor becomes the familiar sinc function:
So the half-power point is at sin θ_h = 2(1.3916)/(Nkd) = 0.443 λ/(Nd). For a long array θ_h is small, sin θ_h ≈ θ_h, and the beamwidth is twice that:
First-Null Beamwidth (FNBW)
The first-null beamwidth is the angle between the first nulls on either side of the main lobe. It shows how wide the main lobe is at its base and is used in resolution and interference calculations. The nulls of the array factor are where the numerator vanishes but the denominator does not:
Side-Lobe Level
Between consecutive nulls the array factor rises to a side lobe. The side-lobe peaks lie close to where the numerator is ±1, i.e. Nψ/2 = ±3π/2, ±5π/2, … The first one gives the first side-lobe level:
To push side lobes lower, the elements are tapered: the centre elements are fed more strongly than the edge ones. Binomial weighting removes side lobes entirely, Dolph–Chebyshev gives the narrowest beam for a chosen side-lobe level, and Taylor weighting is the common compromise in radar. Every taper widens the main beam and lowers the directivity slightly — a trade-off you will meet again in Part 6.
Steering the Main Beam and Grating Lobes
The main beam is where ψ = 0. With a progressive phase β between elements, that condition moves away from broadside — the principle of the phased array:
AF_n is periodic in ψ with period 2π, so it has a full-strength maximum not only at ψ = 0 but also at ψ = ±2π, ±4π… If one of those extra maxima falls inside the range of real angles (|sin θ| ≤ 1) it produces a grating lobe — a second main beam pointing in the wrong direction. Keeping the spacing below the limit above prevents it; λ/2 spacing is safe for any steering angle, which is why it is the default element spacing.
Front-to-Back Ratio
The front-to-back ratio (F/B) compares the radiation in the main direction with the radiation in the opposite direction:
A high F/B keeps a directional antenna from picking up interference from behind and from radiating into the building it is mounted on. A dipole has F/B = 0 dB; a patch on a finite ground plane about 10–20 dB; a well-designed Yagi 15–25 dB; a dish 30 dB or more.
Radiation Pattern Measurement
Patterns are measured by rotating the antenna under test (AUT) on a positioner while a fixed source antenna illuminates it, and recording the received level at every angle. The measurement must approximate free space and the far field:
| Facility | How it works | Typical use |
|---|---|---|
| Anechoic chamber | A shielded room lined with RF absorber, so only the direct path from source to AUT remains | Most antennas up to a few wavelengths across, 400 MHz – 110 GHz |
| Outdoor far-field range | Source and AUT on towers, separated by at least 2D²/λ | Large, low-frequency antennas |
| Compact antenna test range | A reflector turns a spherical wave into a plane wave within a short distance | Large, high-gain antennas indoors |
| Near-field scanner | A probe samples amplitude and phase close to the antenna; software transforms them to the far field | Phased arrays and very large apertures |
The minimum distance, the Fraunhofer distance 2D²/λ, comes from the near- and far-field theory of Part 3. Simulators such as the Method of Moments solver in the Dipole & Monopole Antenna Calculator compute the far field directly, which is how the patterns in this article were produced.
Worked Examples
Far Field of a Short Dipole
Problem: A 2 cm current element carries I = 1 A at 300 MHz (λ = 1 m, so L = λ/50). Find |E| at 1 km broadside, and at 1 km in the direction θ = 30°.
The ratio 1.88/3.77 = 0.5 is just F(30°) = sin 30°: once the pattern is known, the field in any direction follows from the field in one direction.
Beamwidth of a Short and a Half-Wave Dipole
Problem: Find the E-plane HPBW of a short dipole, F(θ) = sin θ, and of a half-wave dipole, F(θ) = cos(π/2 · cos θ)/sin θ.
The half-wave equation g(θ) = cos(π/2 · cos θ)/sin θ − 0.7071 = 0 has no closed-form solution. Bisection between θ = 45° (g = −0.08) and θ = 60° (g = +0.11) converges to θ_h = 50.96°, so HPBW = 2(90° − 50.96°) = 78.1°.
The calculator's Method of Moments model of a real 2 mm wire, cut to 0.479 λ for resonance, reports 80° — the slightly shorter element behaves a little more like a short dipole.
What Does −12.4 dB Mean?
Problem: The side lobes of the directional pattern are at −12.4 dB. What fraction of the main-lobe field and power is that?
On a linear plot this side lobe would be almost invisible; on a dB plot it is obvious. That is why patterns are normally drawn in dB.
Beamwidths of a Four-Element Array
Problem: Estimate the FNBW and HPBW of four elements spaced λ/2 apart (Nd = 2λ) and compare with Fig 5.
The 0.886 λ/(Nd) rule assumes a long array; with only four elements it is 4% low. The element pattern then narrows the beam slightly — pattern multiplication at work.
Doubling the Array Length
Problem: The array is extended to 8 elements at λ/2 spacing (Nd = 4λ). Find HPBW and FNBW, and the first side-lobe level.
Doubling the length halves the beamwidth, and the side lobes move closer to the −13.46 dB limit of a long uniform array.
Side-Lobe Level of a Four-Element Array
Problem: Estimate the first side-lobe level of a uniform 4-element array of isotropic elements, and explain why the directional pattern of Fig 4 shows −12.4 dB instead.
The side lobe sits at θ ≈ 46°, where the element pattern (1 + 0.6 cos 46°)/1.6 = 0.885 = −1.1 dB. Pattern multiplication adds the two in dB: −11.3 − 1.1 = −12.4 dB.
Steering an Array to 30°
Problem: The 8-element, λ/2-spaced array must point at θ₀ = 30°. Find the progressive phase β, the approximate HPBW, and the maximum spacing that avoids grating lobes at this angle.
Each element is fed 90° behind its neighbour on the side the beam leans towards. The beam is 16% wider than at broadside.
When Do Grating Lobes Appear?
Problem: An engineer spaces the 8 elements one full wavelength apart to make a longer array with the same element count. Where do grating lobes appear at broadside, and at what spacing would they appear for a beam steered to 45°?
At broadside the d = λ array is right on the limit — any steering pulls a grating lobe fully into view. The red dashed curve in Fig 6 shows these end-fire lobes.
Front-to-Back Ratio From a Pattern
Problem: The directional pattern of Fig 4 has 0 dB at 0° and −12.0 dB at 180°. The FR-4 patch of this article has a realized gain of 2.48 dBi forward and −9.5 dBi directly behind. Find both F/B ratios, and derive the 12.0 dB of the array from its element pattern.
The array factor of a broadside array is identical at 0° and 180° (ψ = 0 in both directions), so the whole front-to-back ratio comes from the element pattern. When both levels are in dBi, F/B is simply their difference; the patch calculator reports 12.0 dB on FR-4 and 13.4 dB on Rogers.
Beam Footprint at a Distance
Problem: How wide is the −3 dB footprint of the 25.9° beam at 1 km, and of the 12.8° beam of Example 5?
Anything inside that width receives within 3 dB of the peak signal. Doubling the array length halves the footprint — and, as Part 6 shows, doubles the directivity.
Summary
- A radiation pattern shows how radiation varies with direction in the far field; it is the same for transmitting and receiving.
- 3D patterns give the overall shape; 2D polar or rectangular cuts, especially the E-plane and H-plane, give the numbers.
- Isotropic patterns are a reference only; omnidirectional antennas cover one plane uniformly; directional antennas concentrate energy in one main lobe.
- HPBW (−3 dB) and FNBW describe beam width; side-lobe level and front-to-back ratio describe unwanted radiation.
- Patterns follow from the current: sin θ for a short dipole, cos(π/2 · cos θ)/sin θ for a half-wave dipole, element pattern × array factor for an array.
- A uniform array has HPBW ≈ 0.886 λ/(Nd), FNBW = 2 sin⁻¹(λ/Nd) and side lobes no lower than about −13.5 dB; a progressive phase steers the beam, and spacing below λ/(1 + |sin θ₀|) avoids grating lobes.
- Patterns are measured in anechoic chambers, far-field and compact ranges, or with near-field scanners.
A pattern tells us the shape of the radiation. Part 5: Radiation Intensity and Power Density puts numbers on it, in watts per square metre and watts per steradian.
Put It Into Practice
Use the NEXT ANTENNAS calculators to apply the ideas from this article to real antennas.