Noise Figure — Complete Reference Guide
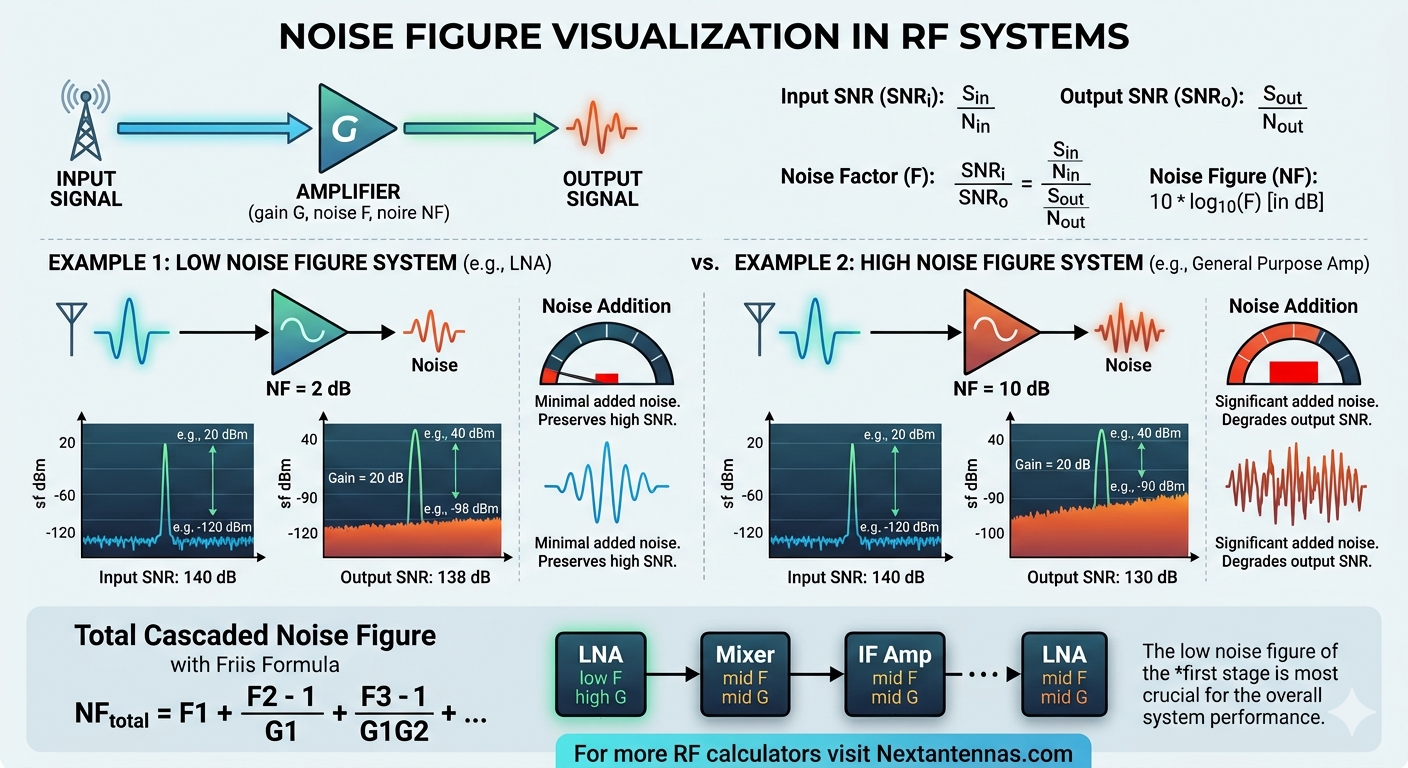
Every RF receiver degrades the signal-to-noise ratio of the signal it processes. The noise figure (NF) quantifies exactly how much degradation occurs. Understanding noise figure is fundamental to receiver design, link budget analysis, and selecting the right components for any RF system.
What is Noise Figure?
Noise figure is the ratio of the signal-to-noise ratio at the input of a device to the signal-to-noise ratio at its output, expressed in decibels. A perfect, noiseless amplifier would have NF = 0 dB — it amplifies the signal and the noise equally, so the SNR is unchanged. Every real component adds some noise, so NF > 0 dB always.
Noise figure definition
NF
=
10 · log10
(
SNRin
SNRout
)
[dB]
NF
=
10 · log10(F)
where
F
=
SNRin
SNRout
(linear noise factor)
The noise factor F (linear, dimensionless) and the noise figure NF (in dB) carry the same information in different forms. The Friis cascade formula always uses F (linear) — remember to convert before applying it.
Key conversion: F = 10^(NF/10) · NF = 10·log₁₀(F)
Example: NF = 3 dB → F = 10^(0.3) = 2.00 | NF = 0.5 dB → F = 10^(0.05) = 1.122
Thermal Noise Floor
At room temperature (T₀ = 290 K), the available thermal noise power spectral density from any passive source is:
Thermal noise floor
N0
=
k · T0
=
1.381×10−23 × 290
=
4.00×10⁻²¹ W/Hz
N0
=
−174 dBm/Hz
at T0 = 290 K
For any finite bandwidth B, the total noise power is N = −174 + 10·log₁₀(B) dBm. For a 20 MHz LTE channel: N = −174 + 73 = −101 dBm. This is the absolute minimum noise floor — any receiver will have a higher noise floor due to its own added noise (NF > 0 dB).
Friis Cascaded Noise Figure Formula
When multiple stages are connected in series, the total system noise factor is given by the Friis formula, derived by Harald T. Friis in 1944:
Friis cascade formula (linear noise factors and gains)
| Ftotal |
= |
F1 |
+ |
F2−1
G1
|
+ |
F3−1
G1 · G2
|
+ |
F4−1
G1 · G2 · G3
|
+ … |
Where F₁, F₂, F₃ … are the linear noise factors of each stage and G₁, G₂, G₃ … are the linear power gains (not dB). The formula reveals the most critical insight in receiver design:
- The first stage dominates. F₁ appears undivided — any noise it adds goes directly into the system NF.
- High first-stage gain suppresses subsequent noise. F₂ is divided by G₁, F₃ by G₁·G₂, and so on. A 20 dB (100×) LNA before a 10 dB NF mixer reduces the mixer's NF contribution to just 0.09 dB.
- Loss before the first stage is catastrophic. A 3 dB cable before the LNA adds 3 dB directly to system NF — equivalent to halving the SNR at the input.
Design rule: Place your lowest-NF, highest-gain stage first. A good LNA (NF = 0.5 dB, G = 20 dB) as the first stage makes everything else nearly irrelevant to system NF.
Equivalent Noise Temperature
Noise temperature T_e is an alternative representation of noise figure, preferred in satellite and radio astronomy applications where very low NF values (fractions of a dB) need to be distinguished with more precision:
Noise temperature conversion
Te
=
(F − 1) · T0
[K] T0 = 290 K
F
=
1 +
Te
T0
Minimum Detectable Signal (MDS) and Receiver Sensitivity
The minimum detectable signal is the weakest signal power at the receiver input that can be detected with the required SNR margin:
Receiver sensitivity / MDS
MDS
=
−174
+
10 · log10(B)
+
NFsys
+
SNRmin
[dBm]
Every 1 dB improvement in system NF directly improves receiver sensitivity by 1 dB. In a free-space link (path loss ∝ R²), this extends maximum range by 12% per dB of NF improvement.
Typical Noise Figure Values by Component
| Component |
Typical NF |
Notes |
| Low-noise amplifier (LNA) — GaAs | 0.3–0.8 dB | Satellite, GPS front ends |
| Low-noise amplifier (LNA) — CMOS | 1.0–2.5 dB | Wi-Fi, 5G sub-6 GHz |
| RF amplifier | 2–5 dB | General purpose gain stages |
| Passive mixer (diode) | 6–8 dB | NF ≈ conversion loss |
| Active mixer | 8–15 dB | Higher NF, provides gain |
| Cable / transmission line | = loss (dB) | NF of passive element = its insertion loss |
| RF switch / relay | 0.3–2 dB | = insertion loss |
| Bandpass filter | 0.5–3 dB | = insertion loss |
| Attenuator (passive) | = attenuation | NF always equals attenuation value |
The Critical Rule: Passive Components Before the LNA
For any passive component with insertion loss L_dB placed before the LNA, its noise figure contribution equals its loss exactly. A 1 dB filter before a 0.5 dB NF LNA gives a system NF of approximately 1 + 0.5 = 1.5 dB — the filter has tripled the system noise compared to the LNA alone. This is why tower-mounted LNAs (mounted physically at the antenna, before the cable run) dramatically improve base station receiver sensitivity.
Passive element rule: The noise figure of any passive element at temperature T₀ equals its insertion loss in dB. A 3 dB attenuator has NF = 3 dB and noise factor F = 2 — it doubles the system noise power.
NF of Attenuators and Lossy Elements
For a passive attenuator with attenuation A (linear, A ≥ 1, so gain = 1/A), the noise factor is exactly:
Passive attenuator noise factor
Fatt
=
A
(linear, A ≥ 1)
NFatt
=
10 · log10(A)
=
insertion loss in dB
Worked Example — Typical Receiver Chain
A 5G NR receiver at 3.5 GHz with the following chain:
- Bandpass filter: NF = 1.5 dB, Gain = −1.5 dB
- LNA: NF = 1.2 dB, Gain = 18 dB
- Mixer: NF = 8 dB, Gain = −6 dB (conversion loss)
- IF amplifier: NF = 5 dB, Gain = 20 dB
Step 1 — Convert to linear F and G using F = 10^(NF/10)
F1
=
101.5/10
=
1.413
G1
=
10−1.5/10
=
0.708
F2
=
101.2/10
=
1.318
G2
=
1018/10
=
63.10
F3
=
108.0/10
=
6.310
G3
=
10−6/10
=
0.251
F4
=
105.0/10
=
3.162
G4
=
1020/10
=
100.0
Step 2 — Apply Friis formula
| Ftotal |
= |
1.413 |
+ |
1.318−1
0.708
|
+ |
6.310−1
0.708 × 63.10
|
+ |
3.162−1
0.708 × 63.10 × 0.251
|
| Ftotal |
= |
1.413 |
+ |
0.449 |
+ |
0.119 |
+ |
0.192 |
| Ftotal |
= |
2.173 |
| NFtotal |
= |
10 · log10(2.173) = 3.37 dB
|
Note that the filter in position 1 contributes 0.449 to F_total — the second-largest contribution despite having a lower NF than the mixer. This is because it precedes the LNA, so its noise penalty is not suppressed by any preceding gain. Moving the LNA to position 1 (before the filter) would reduce system NF by approximately 1.2 dB.