Plotting Impedance: The Core Smith Chart Skill
Every Smith chart task — reading a VNA trace, finding a line's input impedance, designing a matching network — starts with the same operation: putting an impedance on the chart and reading information back off it. Part 6 explained the geometry and Part 8 introduced the circles and scales. This article turns that knowledge into a repeatable procedure you can apply to any load.
1. Identify Z_L and Z₀ → 2. Normalise: z = Z_L/Z₀ → 3. Find the r circle → 4. Find the x arc → 5. Mark the intersection → 6. Draw the VSWR circle through it → 7. Read |Γ|, ∠Γ, VSWR and return loss → 8. Convert back to ohms (and to admittance if needed).
Identifying Load Impedance
The load impedance Z_L = R_L + jX_L is whatever terminates the line or network you are analysing: an antenna feed point, the input of an amplifier, a filter, or a component on a test fixture. Before plotting, make sure of four things:
- The frequency. Impedance changes with frequency, so a single point on the chart is valid at one frequency only. A measured antenna gives a curve, one point per frequency.
- The reference plane. Know exactly where Z_L is defined — at the antenna terminals or at the end of a feed cable. A cable between them rotates the point (Part 5).
- Series form. The chart's impedance grid uses the series form R + jX. If a datasheet gives a parallel R ∥ X model, convert it first (or plot it as an admittance).
- The sign of X. Positive reactance is inductive, negative is capacitive. A sign error puts the point in the wrong half of the chart.
Normalizing Load Impedance
The chart is drawn for a reference impedance of 1. Divide the load by the system's characteristic impedance — usually 50 Ω, or 75 Ω for video and cable-TV systems (Part 7):
Locating Resistance and Reactance
Resistance. The r circles are labelled along the horizontal axis: 0 at the left edge, 1 at the centre, ∞ at the right edge. Find the circle whose label matches r. If r falls between printed circles (say 0.7 between 0.5 and 1), imagine a circle between them — on a calculator, the exact circle is drawn for you.
Reactance. The x arcs are labelled around the rim: +j values on the upper half, −j values on the lower half, with +j1 at the top and −j1 at the bottom. Follow the arc for your x from the rim inward. Remember that x = 0 is the horizontal axis itself.
Plotting Complex Impedance
The impedance point is the intersection of the r circle and the x arc. Every r circle crosses every x arc exactly once inside the chart, so the point is unique. Two quick sanity checks catch most mistakes:
- Half: inductive loads (x > 0) must be above the horizontal axis; capacitive loads below.
- Side: r < 1 puts the point inside the left part of the chart (outside the r = 1 circle); r > 1 puts it inside the r = 1 circle.
Drawing Constant VSWR Circles
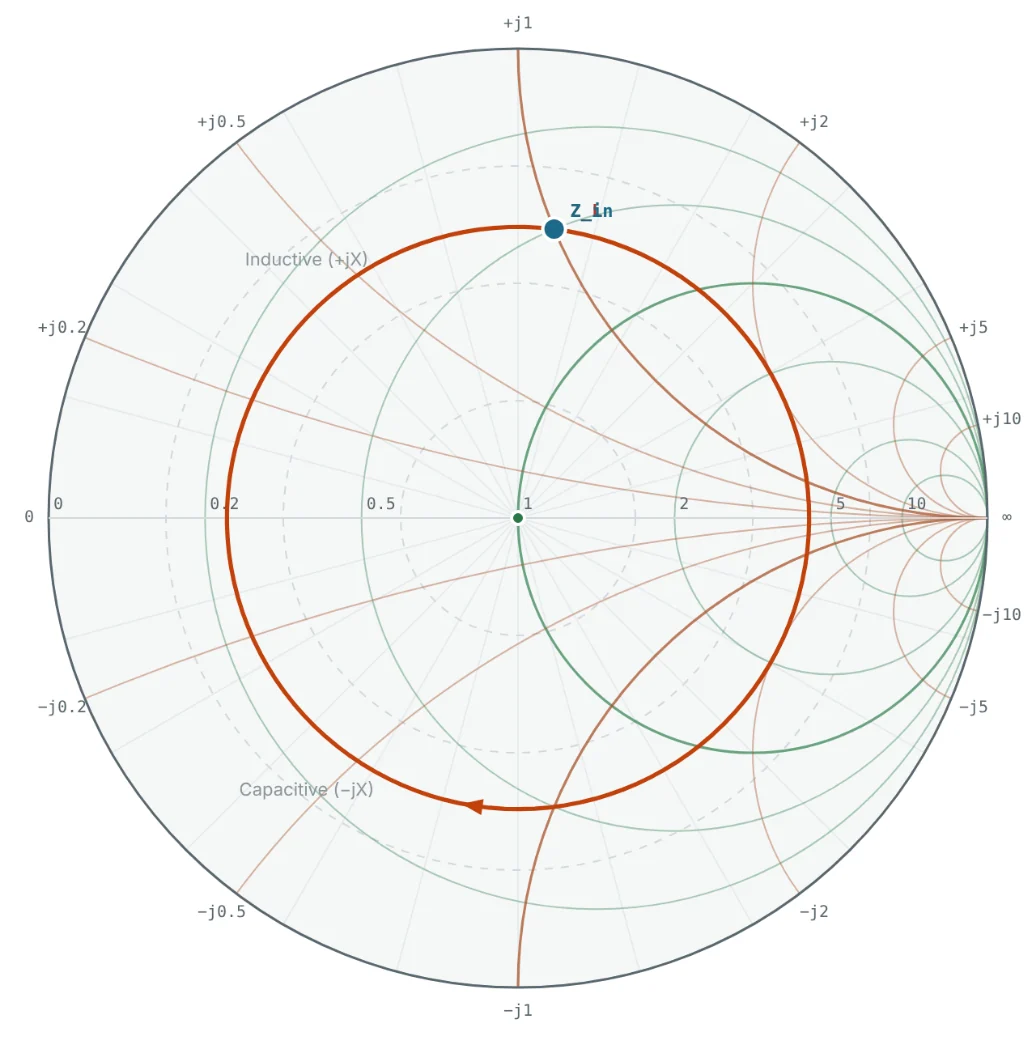
Place a compass point on the centre of the chart and draw a circle through the load point. This is the load's constant-VSWR circle (also called the constant-|Γ| circle). Every impedance seen looking toward the load along a lossless line lies on this circle, because the line changes only the angle of Γ, not its magnitude.
- Moving toward the generator (away from the load) rotates the point clockwise.
- Moving toward the load rotates it anticlockwise.
- One full turn is λ/2 of line, because Γ rotates by 2βd = 720° per wavelength.
That is how Fig 1 was produced: adding a 0.5λ line in the calculator rotates the point once around its VSWR circle and back to where it started.
Finding the Reflection Coefficient
Magnitude. |Γ| is the distance from the centre to the point, as a fraction of the chart radius. On paper, measure both with a ruler and divide, or transfer the distance to the "reflection coefficient" scale printed below most charts.
Angle. Draw a line from the centre through the point to the rim and read the angle on the outer "angle of reflection coefficient" scale. 0° points to the right (open-circuit end), +90° to the top, ±180° to the left (short-circuit end) and −90° to the bottom.

Determining VSWR From the Chart
The VSWR circle crosses the horizontal axis at two points. Where it crosses the right-hand axis (r > 1), the normalised resistance equals the VSWR directly. Where it crosses the left-hand axis, the resistance is 1/VSWR. No calculation is needed — read the r label at the crossing.
Converting Plotted Values Back to Actual Impedance
Any point read off the chart is normalised. Multiply by Z₀ to get ohms. For admittance, use the fact that rotating a point by 180° about the centre turns z into its reciprocal y = 1/z — the point diametrically opposite on the VSWR circle. Then divide by Z₀ (or multiply by Y₀ = 1/Z₀) to get siemens:
Step-by-Step Solved Examples
All examples use Z₀ = 50 Ω. Each load can be entered directly in the Smith Chart Calculator to check the graphical result.
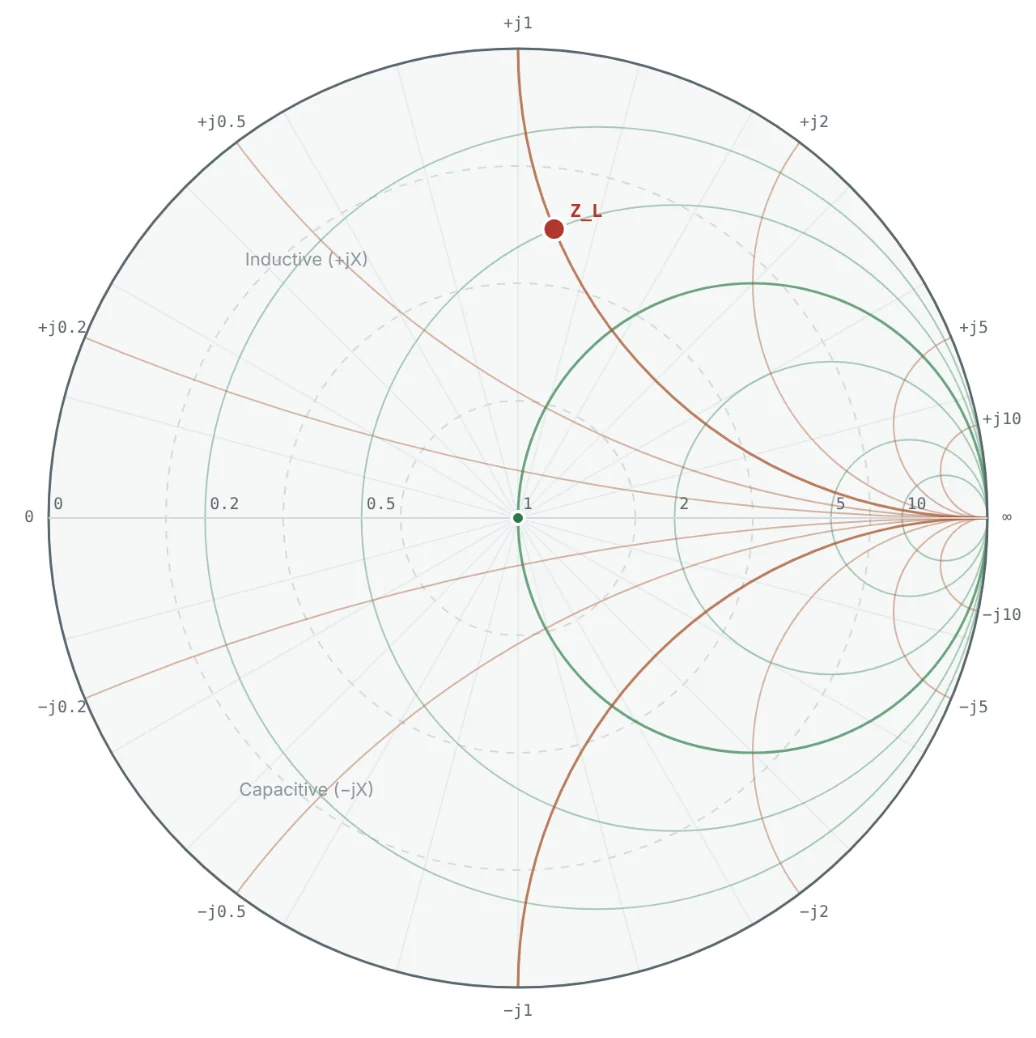
Inductive Load: 25 + j50 Ω
Problem: Plot Z_L = 25 + j50 Ω and find Γ, VSWR, return loss and the load admittance.
- Normalise: z = (25 + j50)/50 = 0.5 + j1.
- Plot: intersection of the r = 0.5 circle and the x = +1 arc (Fig 2) — upper half, inductive.
- VSWR circle: centred on the chart through the point; it crosses the right axis at r ≈ 4.27.
- Γ: the point is 0.62 of the radius from the centre at 82.9° → Γ = 0.620 ∠ 82.9°.
- Return loss: −20 log 0.620 = 4.15 dB.
- Admittance: rotate 180° → y = 0.4 − j0.8 → Y = (0.4 − j0.8)/50 = 8 − j16 mS.
All four values match the calculator readout in Fig 4 exactly. With a VSWR above 4, about 38% of the incident power is reflected — this load needs matching (we match it in Part 10).
Capacitive Load: 75 − j25 Ω
Problem: Plot Z_L = 75 − j25 Ω and find Γ, VSWR and return loss. Does it meet a −10 dB S11 specification?
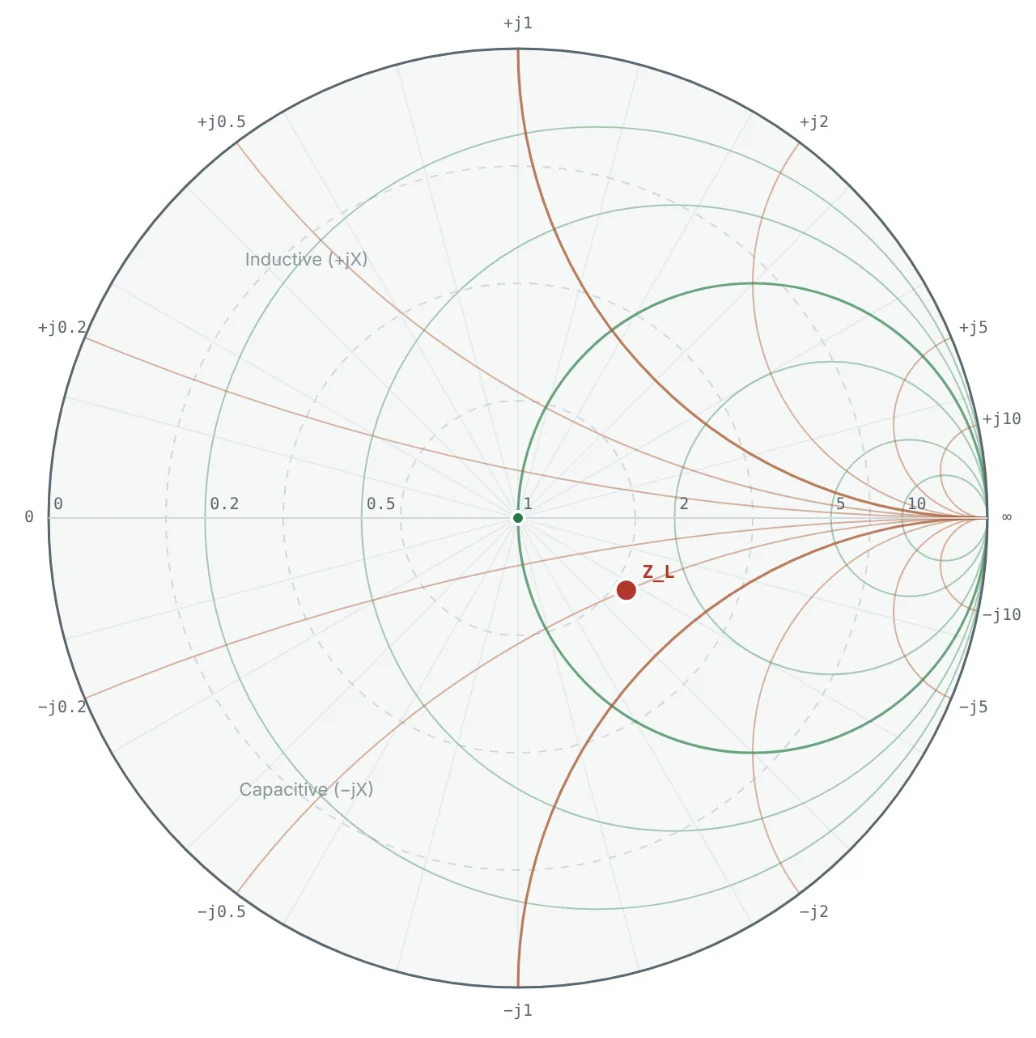

The −10 dB contour is the circle |Γ| = 0.316 (VSWR 1.92). Any load plotted inside that circle meets the spec, which is why VSWR circles are such a fast visual check.
Low-Resistance Load: 10 Ω
Problem: A power transistor presents 10 Ω (resistive) to a 50 Ω line. Plot it and read the VSWR without using the formula.
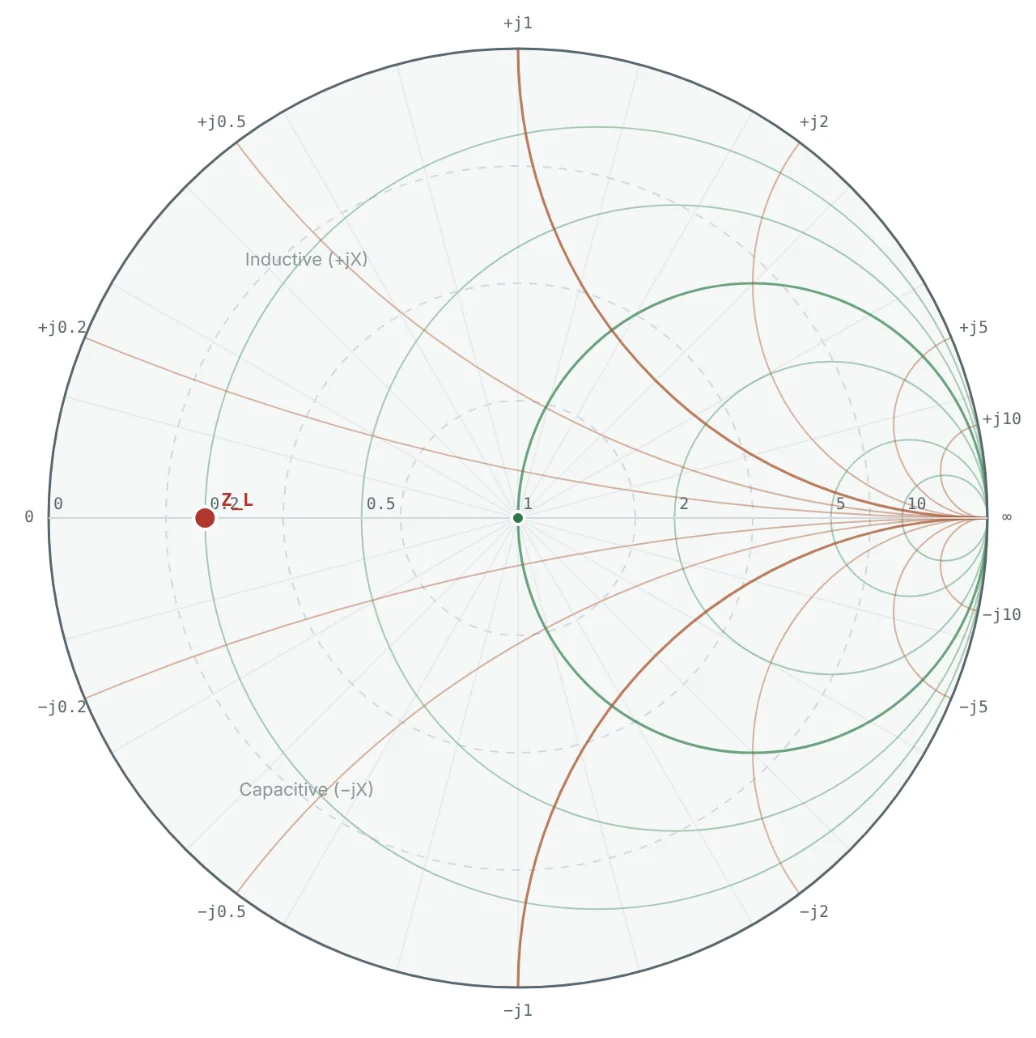

The VSWR circle through z = 0.2 crosses the right axis at r = 1/0.2 = 5, so the VSWR is 5 by inspection. Low-impedance loads like this are typical of power amplifier outputs and are matched with low-pass L or π networks.
Reading an Impedance Back From the Chart
Problem: A VNA marker shows a point at |Γ| = 0.45, angle 120°. What are the impedance and the VSWR?
On the chart the point sits just outside the r = 0.5 circle and just below the x = +0.5 arc — reading r ≈ 0.48 and x ≈ 0.47 by eye gives the same answer to two figures, which is the usual accuracy of a paper chart.
Voltage Maximum and Minimum Positions
Problem: For the 25 + j50 Ω load, how far from the load is the first voltage maximum on the line, and what impedances are seen at the voltage maximum and minimum?
The green arrow in Fig 5 shows this rotation. At 2.4 GHz on air-dielectric line (λ = 125 mm) the maximum is 14.4 mm from the load. Measuring the position of a voltage minimum on a slotted line was, for decades, how unknown loads were found — the Smith chart turned that measurement back into an impedance.
Summary
| Step | Action | Result for 25 + j50 Ω |
|---|---|---|
| 1. Normalise | z = Z_L / Z₀ | 0.5 + j1 |
| 2. Plot | Intersect r circle and x arc | Upper half, outside r = 1 circle |
| 3. VSWR circle | Centre → through point | |Γ| = 0.62 |
| 4. Γ | Radius ratio and rim angle | 0.620 ∠ 82.9° |
| 5. VSWR | r at right-axis crossing | 4.27 |
| 6. Return loss | −20 log|Γ| | 4.15 dB |
| 7. Admittance | Rotate 180°, divide by Z₀ | 8 − j16 mS |
| 8. Line effect | Rotate clockwise toward generator | V_max at 0.115λ |
- Always normalise first; the same load is a different point in a 50 Ω and a 75 Ω system.
- The impedance point is the unique intersection of one r circle and one x arc.
- The circle centred on the chart through the point is the constant-VSWR circle; a lossless line moves the point around it.
- The VSWR is the r value where that circle crosses the right-hand axis; the admittance is the diametrically opposite point.
With plotting mastered, Part 10: Impedance Matching Using the Smith Chart uses these moves to bring a load to the centre of the chart — designing real matching networks.
Put It Into Practice
Use the NEXT ANTENNAS calculators to apply the ideas from this article to real designs.