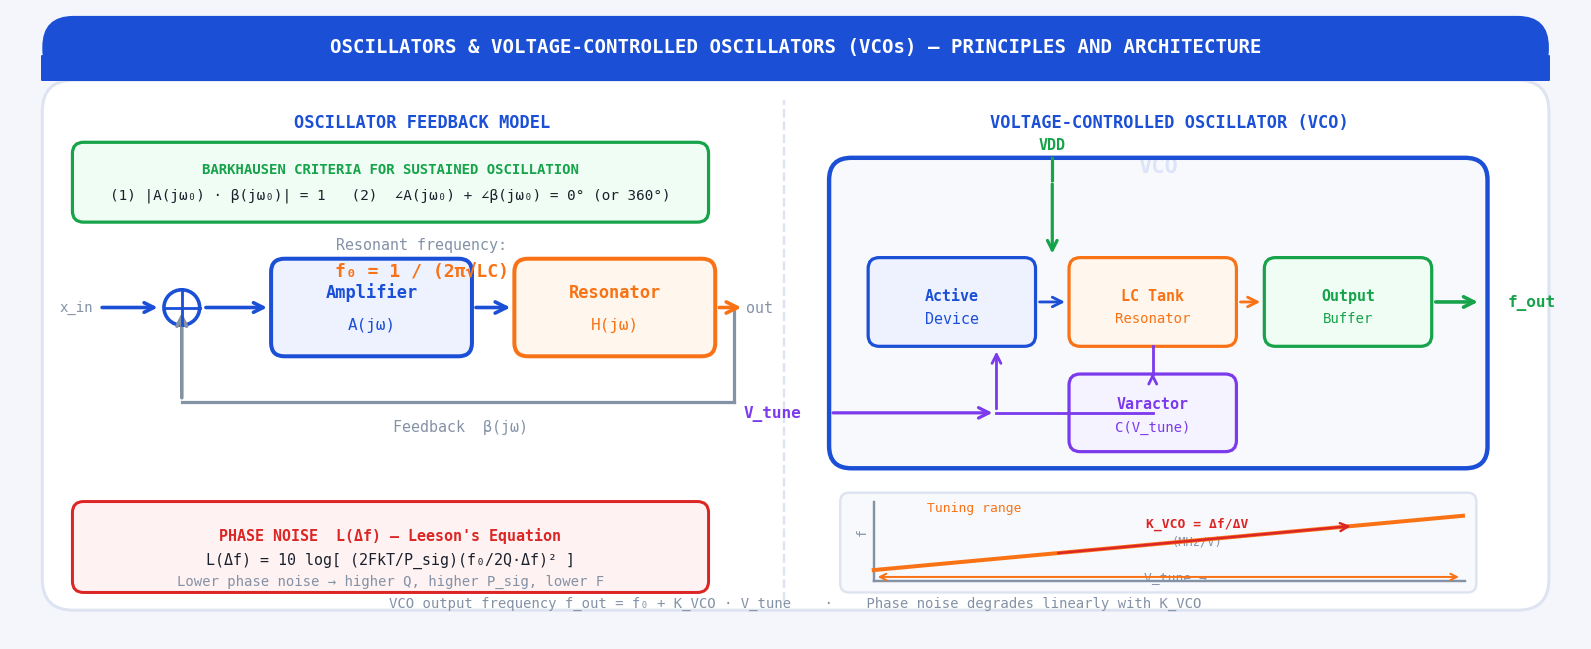
The Role of Oscillators in RF Systems
Every wireless system that transmits or receives a signal needs a stable, accurate frequency reference. The transmitter must modulate a carrier at a precise frequency; the receiver must have a local oscillator (LO) at a precisely known frequency to down-convert the received signal to baseband. The component that generates this frequency reference is the oscillator — and when that frequency must be electronically tuneable, it is a voltage-controlled oscillator (VCO).
Unlike passive components, an oscillator produces an output signal without any RF input — it converts DC power into a periodic AC signal at a frequency determined by its resonant circuit. In a radio system, the VCO output frequency determines the receive or transmit channel. The purity of that frequency — how close it is to a perfect sinusoid — directly affects the system's ability to reject adjacent channels, demodulate data correctly, and meet regulatory spectral emission masks.
In virtually every modern RF system the VCO operates inside a Phase-Locked Loop (PLL). The PLL uses negative feedback to lock the VCO's output frequency to a precise multiple of a stable crystal reference. The VCO provides the frequency agility (wide tuning range); the crystal provides the long-term accuracy and low-frequency stability. This article focuses on the VCO itself; a companion article covers the complete PLL architecture.
Principles of Oscillation
The Feedback Model
An oscillator can be understood as a feedback amplifier in which the feedback is positive and tuned to a specific frequency. The block diagram shows an amplifier with voltage gain A(jω) and a frequency-selective feedback network with transfer function β(jω). The closed-loop gain is:
The Barkhausen Criteria
The conditions for sustained, steady-state oscillation at frequency ω₀ are known as the Barkhausen criteria. Both must be satisfied simultaneously at the same frequency:
In practice, an oscillator is designed with initial loop gain slightly greater than 1 (|Aβ| > 1) to ensure reliable start-up from noise. The amplitude then grows until the transistor enters a nonlinear region (compression), which reduces the effective gain until the steady-state condition |Aβ| = 1 is reached automatically. This self-limiting mechanism sets the oscillation amplitude.
The Negative Resistance Model
An alternative but equivalent view is the negative resistance model. An LC tank circuit has energy losses represented by a parallel resistance R_p (from inductor winding resistance, substrate loss, and radiation). These losses cause oscillations to decay. The active device (transistor) introduces a negative resistance −R_act into the circuit. Sustained oscillation requires:
LC Oscillator Topologies
Colpitts Oscillator
The Colpitts oscillator uses a capacitive voltage divider (C1 and C2 in series) as the feedback network, with an inductor L completing the LC resonant tank. The feedback fraction is β = C1/(C1 + C2), and the resonant frequency is:
The Colpitts is widely used in RF ICs because the capacitive divider is easily implemented as MOS capacitors or varactors. The common-source Colpitts (gate as input, source to tank tap) and common-base Colpitts (Clapp variant) are both standard RFIC building blocks.
Hartley Oscillator
The Hartley oscillator is the inductive dual of the Colpitts — the feedback is taken from a tapped inductor (L1 and L2 in series with mutual coupling M) and a single capacitor C completes the tank. The resonant frequency is:
Cross-Coupled LC VCO (Differential)
The cross-coupled differential LC VCO is the dominant topology in modern RFIC design. Two transistors (M1 and M2 in CMOS, or Q1 and Q2 in SiGe) are cross-connected: the drain/collector of M1 drives the gate/base of M2, and vice versa. This cross-coupling creates a negative resistance of −2/g_m presented differentially across the LC tank:
Key advantages of the cross-coupled LC VCO: differential output (ideal for driving a double-balanced mixer directly), common-mode supply rejection, and the ability to use on-chip spiral inductors with Q of 5–20 at 1–10 GHz. It is the circuit behind the local oscillators in virtually every CMOS Wi-Fi, LTE, and 5G chip.
Crystal Oscillators (XO and TCXO)
A quartz crystal is a piezoelectric resonator with an extremely high Q factor (Q = 10,000–100,000) compared to any on-chip LC tank (Q = 5–20). The crystal has a series resonant frequency f_s and a parallel resonant frequency f_p slightly above it. Between f_s and f_p the crystal presents an inductive reactance, which replaces the inductor in a Colpitts or Pierce oscillator circuit.
The Pierce oscillator is the most widely used crystal oscillator topology in ICs, because it requires only one active device, two capacitors (C1 and C2), and the crystal itself — minimising area and power. Its output frequency is set almost entirely by the crystal — the capacitors shift the frequency by a small amount (pulling):
A Temperature-Compensated Crystal Oscillator (TCXO) adds a temperature-sensing circuit and varactor to compensate the crystal's natural frequency vs temperature characteristic (typically ±25 ppm over −40 to +85°C uncompensated, reduced to ±0.5 ppm with compensation). An Oven-Controlled Crystal Oscillator (OCXO) keeps the crystal at a constant elevated temperature (typically 70–85°C), achieving ±0.01 ppm stability — used in GPS references and test equipment.
Phase Noise
Definition and Impact
An ideal oscillator produces a single spectral line at exactly f₀. A real oscillator has random fluctuations in both amplitude and phase. The amplitude noise is usually suppressed by the oscillator's amplitude-limiting mechanism, but phase noise — random, short-term phase fluctuations — cannot be filtered and appears as spectral energy spread around the carrier. Phase noise is specified as the single-sideband power in a 1 Hz bandwidth at an offset frequency Δf from the carrier, normalised to the carrier power:
Phase noise in a receiver LO causes reciprocal mixing: a strong adjacent-channel interferer mixes with the LO's phase noise skirt and falls on top of the desired channel, raising the noise floor and reducing sensitivity. In a transmitter, phase noise causes spectral regrowth — energy spreads into adjacent channels, violating regulatory emission masks. Phase noise is therefore a fundamental system-level constraint, not just a VCO specification.
Leeson's Equation
The classic model for oscillator phase noise was derived by D. B. Leeson in 1966. Leeson's equation relates the phase noise to the oscillator's key physical parameters:
Leeson's equation identifies the key levers for phase noise improvement:
- Maximise Q. Phase noise ∝ 1/Q². Doubling Q improves phase noise by 6 dB. This is the single most powerful lever — driving the use of high-Q inductors, BAW/SAW resonators, and crystal references.
- Maximise P_sig. Phase noise ∝ 1/P_sig. Doubling the signal power in the tank improves phase noise by 3 dB. Limited by breakdown voltage and DC power budget.
- Minimise noise figure F. Lower transistor noise (lower F) improves phase noise directly. This connects oscillator design back to the transistor selection criteria discussed in the LNA series.
- Reduce f_1/f (flicker corner). Flicker noise up-converts to phase noise near the carrier (within f_1/f of the oscillation frequency). Low-flicker transistors (SiGe HBT, long-channel CMOS) reduce close-in phase noise.
The phase noise spectrum has three characteristic regions as a function of offset frequency Δf: a 1/Δf³ (−30 dB/decade) region very close to the carrier, dominated by upconverted 1/f flicker noise; a 1/Δf² (−20 dB/decade) region (the Leeson region) dominated by white thermal noise; and a flat noise floor at large offsets, set by the buffer amplifier noise. The corner between 1/Δf³ and 1/Δf² is the Leeson corner frequency f_L = f₀/(2Q).
Voltage-Controlled Oscillators (VCOs)
VCO Operating Principle
A VCO is an oscillator whose output frequency is a function of an applied control voltage V_tune. By replacing a fixed capacitor in the LC tank with a voltage-dependent capacitor (varactor), the resonant frequency — and therefore the output frequency — becomes tuneable:
Varactors — The Tuning Element
A varactor (variable capacitor) is a reverse-biased p-n junction diode whose depletion capacitance varies with the applied reverse voltage. As the reverse voltage V_R increases, the depletion region widens and the capacitance decreases:
In CMOS processes, varactors are typically implemented as NMOS or PMOS accumulation-mode capacitors (A-MOS varactors), which offer higher Q than p-n junction varactors at RF frequencies and integrate naturally in a standard CMOS process. The capacitance tuning ratio C_max/C_min is typically 2–4 for a CMOS A-MOS varactor, determining the achievable frequency tuning range.
VCO Gain K_VCO and Tuning Sensitivity
K_VCO (pronounced "K-VCO") is the slope of the f vs V_tune characteristic — the frequency change per unit control voltage:
K_VCO is a fundamental PLL design parameter. A higher K_VCO gives a wider frequency tuning range but introduces a critical trade-off: K_VCO directly multiplies any noise on the V_tune control line, converting voltage noise into frequency noise (phase noise). In a PLL, supply noise and digital switching noise on the V_tune line create sidebands on the VCO output at the noise frequency. The resulting spurious tones (reference spurs) must be suppressed by the PLL loop filter. This is why wideband VCOs (high K_VCO) are harder to integrate without spur problems.
Tuning Range
The tuning range TR of a VCO is typically expressed as a percentage of the centre frequency:
For very wide tuning ranges, a switched-capacitor bank is added in parallel with the varactor. A binary-weighted array of MOS switches selects coarse frequency bands (covering the required range in steps), while the varactor provides fine frequency adjustment within each band. This architecture — used in virtually all modern fractional-N synthesisers — separates the coarse tuning (low K_VCO, good phase noise) from fine tuning (high K_VCO but small range, acceptable spur level).
Ring Oscillators
A ring oscillator consists of an odd number N of inverting stages (typically 3, 5, or 7) connected in a loop. The total phase shift around the loop is 180° from the odd number of inversions plus 180° from the time delay through the chain — satisfying the Barkhausen phase condition. The oscillation frequency is:
Ring oscillators have several advantages: they require no inductor (saving substantial die area), are easily integrated in digital CMOS processes, have a wide tuning range, and are inherently differential if differential delay cells are used. Their critical disadvantage is much worse phase noise than LC VCOs — typically 20–30 dB worse at the same frequency and power — because they lack a high-Q resonator to stabilise the phase. Ring oscillators are used in clock generation, digital delay-locked loops (DLLs), and on-chip timing references where area and power matter more than spectral purity.
VCO Figure of Merit
Comparing VCOs designed at different frequencies, power levels, and tuning ranges requires a normalised figure of merit. The most widely used is:
A variant that also rewards wide tuning range is:
VCO Integration in a Phase-Locked Loop
In nearly every practical RF application, the VCO operates as part of a Phase-Locked Loop (PLL). The PLL forces the VCO output frequency to equal N × f_ref, where f_ref is a crystal reference frequency and N is a programmable integer (or fractional-N) divider value. The loop continuously corrects the VCO frequency by comparing the divided output phase with f_ref and adjusting V_tune through a loop filter.
The VCO's role in the PLL introduces important design considerations:
- Loop bandwidth determines noise filtering. The PLL suppresses VCO phase noise inside the loop bandwidth (where the reference is cleaner) and passes it outside. VCO phase noise at offsets beyond the loop bandwidth passes directly to the output. Optimising loop bandwidth balances reference phase noise vs VCO phase noise.
- K_VCO sets loop gain. The open-loop gain of the PLL is proportional to K_VCO × I_CP (charge pump current). A stable loop requires proper phase margin, set by the loop filter zero. Changes in K_VCO (due to VCO nonlinearity) shift the loop gain and can destabilise the PLL.
- VCO pushing and pulling. Pushing is the sensitivity of VCO frequency to supply voltage (Hz/V); pulling is the sensitivity to output load impedance changes. Both must be minimised through decoupling and buffering to prevent modulation of the VCO by digital supply noise.
Key VCO Design Parameters
Questions & Worked Examples
Work through each problem fully before reading the solution.
LC Tank Design for 2.4 GHz Colpitts VCO
Problem: Design the LC tank for a Colpitts VCO at 2.4 GHz. Choose L = 2.5 nH (achievable as an on-chip spiral with Q = 12). Find: (a) the total tank capacitance C_eq required, (b) if C1 = 2C2, find C1 and C2, (c) the tank parallel resistance R_p = Q × ω₀ × L, (d) the minimum transconductance g_m for start-up.
With the ratio C1/C2 = 2, the feedback fraction β = C2/(C1+C2) = 1/3. The feedback voltage at the transistor input is one-third of the tank voltage — a moderate feedback ratio that balances start-up reliability against phase noise. A larger ratio (C1 ≫ C2) gives stronger feedback and easier start-up but transfers more transistor noise into the tank.
Phase Noise Estimation Using Leeson's Equation
Problem: The 2.4 GHz VCO from Example 1 has: oscillation power P_sig = 1 mW, loaded Q = 10 (slightly lower than the inductor Q due to varactor losses and transistor loading), device noise figure F = 3 dB (noise factor F = 2), flicker corner f_1/f = 1 MHz. Estimate the phase noise at (a) 100 kHz offset and (b) 1 MHz offset.
The 27 dB difference between 100 kHz and 1 MHz offsets is exactly the expected 20 dB/decade slope plus ~7 dB extra from the flicker noise term (factor 11 vs factor 2). The 1 MHz phase noise of −123 dBc/Hz is reasonable for a CMOS LC VCO at 2.4 GHz — state-of-the-art designs achieve −125 to −130 dBc/Hz at 1 MHz. To improve further: increase Q (better inductor process, reduce varactor losses), increase P_sig (higher bias current, subject to power budget), and use a transistor with lower f_1/f (longer channel length, lower flicker noise).
Varactor and Tuning Range Calculation
Problem: A CMOS VCO uses an A-MOS varactor with C_max = 800 fF and C_min = 300 fF over V_tune = 0–1.8 V. A fixed inductor L = 3.0 nH is in the tank. (a) Find the VCO frequency at V_tune = 0 V and V_tune = 1.8 V. (b) Calculate K_VCO assuming linear tuning. (c) What is the tuning range in percent?
A 48% tuning range covering 3.25–5.31 GHz would cover the entire 5G FR1 sub-6 GHz band from a single VCO — a powerful result. The C_max/C_min ratio of 800/300 = 2.67 maps to a frequency ratio of √2.67 = 1.63, consistent with the calculated f_max/f_min = 5.305/3.254 = 1.63. This square-root dependence means that to double the frequency tuning range, the capacitance tuning ratio must quadruple — a key constraint in varactor and tank design.
VCO Figure of Merit and Comparison
Problem: Compare the following three VCOs using the standard FoM. Which is the best design?
VCO-A: f₀ = 2.4 GHz, L(1 MHz) = −122 dBc/Hz, P_DC = 5 mW, TR = 15%
VCO-B: f₀ = 5.0 GHz, L(1 MHz) = −118 dBc/Hz, P_DC = 8 mW, TR = 20%
VCO-C: f₀ = 2.4 GHz, L(1 MHz) = −115 dBc/Hz, P_DC = 1.2 mW, TR = 18%
Despite operating at more than twice the frequency and having 7 dB worse phase noise than VCO-A, VCO-B wins the FoM comparison because the frequency normalisation term (20 log f₀/Δf) rewards higher operating frequency by 6.4 dB, and its phase noise is still respectable. VCO-C has excellent power efficiency but its 7 dB worse phase noise — probably a consequence of running at very low P_sig — is not fully compensated by the power savings. This illustrates that the FoM is not simply "lowest phase noise wins" or "lowest power wins"; it rewards balanced designs that achieve low phase noise efficiently relative to frequency.
Phase Noise Impact on Adjacent Channel Interference
Problem: A Wi-Fi 802.11ax receiver uses a VCO LO with phase noise L(Δf) = −120 dBc/Hz at 1 MHz offset. An adjacent-channel interferer at 20 MHz offset (one 20 MHz channel away) arrives at the antenna at −30 dBm. The desired signal is at −70 dBm. (a) Calculate the interferer power that reciprocally mixes into the desired channel (1 Hz bandwidth). (b) Estimate the total noise power from reciprocal mixing across the 20 MHz desired channel bandwidth. (c) Does this create a problem?
The reciprocal mixing contribution (−103 dBm) is 8 dB below the thermal noise floor (−95 dBm), so it is negligible in this case. However, if the interferer were 8 dB stronger (−22 dBm, which is realistic for a nearby Wi-Fi AP), the reciprocal mixing noise would equal the thermal floor and degrade the receiver noise figure by 3 dB. IEEE 802.11ax requires the receiver to tolerate a −30 dBm adjacent channel interferer with < 3 dB desensitisation — with L(1 MHz) = −120 dBc/Hz this is just met. A VCO with L(1 MHz) = −110 dBc/Hz would fail this test, illustrating directly how phase noise specification flows from the system's interference scenario.